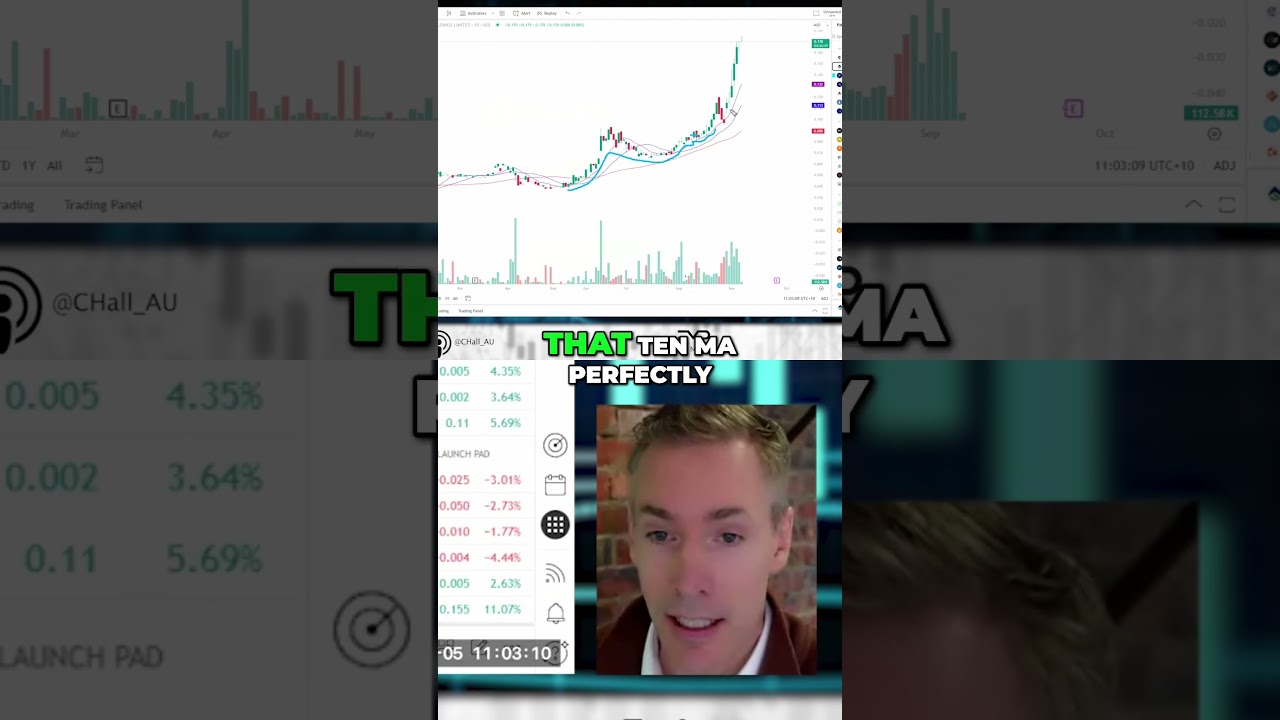
Examine the technical structure emerging in Finder Energy Holdings (FDR.ASX), demonstrating classic characteristics that momentum traders study for pattern recognition education.
This analysis breaks down the specific price action: multiple tight consolidations where volume contracts, followed by expansion as price takes out previous highs whilst respecting the 10-day moving average. The pattern shows five distinct consolidation phases, each tightening in range—a textbook example of the structures discussed in systematic momentum frameworks.
Educational Focus:
Learn to identify tight consolidation patterns, understand volume analysis during base formation, recognise how price respects moving averages during healthy trends, and study the sequence of higher highs without violating prior lows.
This is the type of chart structure that appears in momentum screening systems, demonstrating why systematic traders focus on price tightening, volume characteristics, and moving average relationships rather than predictions.
🎓 FMP YouTube Membership:
Access our complete weekly 3030 Report featuring systematic momentum analysis across ASX sectors, member community discussions, and comprehensive technical education: https://youtube.com/live/o2jaCRQYIow
📊 Company Discussed: FDR.ASX – Finder Energy Holdings
⚠️ GENERAL ADVICE WARNING:
This video provides general educational information only and has been prepared without considering your individual objectives, financial situation, or needs. The content discusses publicly available price and volume data for educational purposes. Before making investment decisions, consult a licensed financial adviser. Presenters may hold positions in discussed securities.
Join this channel to get access to perks:
https://www.youtube.com/channel/UC7N0NPq6REt_F7HOQOGgC9Q/join
| この動画について | |
|---|---|
| URL | https://www.youtube.com/watch?v=JY2hxmEX9RM |
| 動画ID | JY2hxmEX9RM |
| 投稿者 | Finer Market Points |
| 再生時間 | 00:29 |

コメント