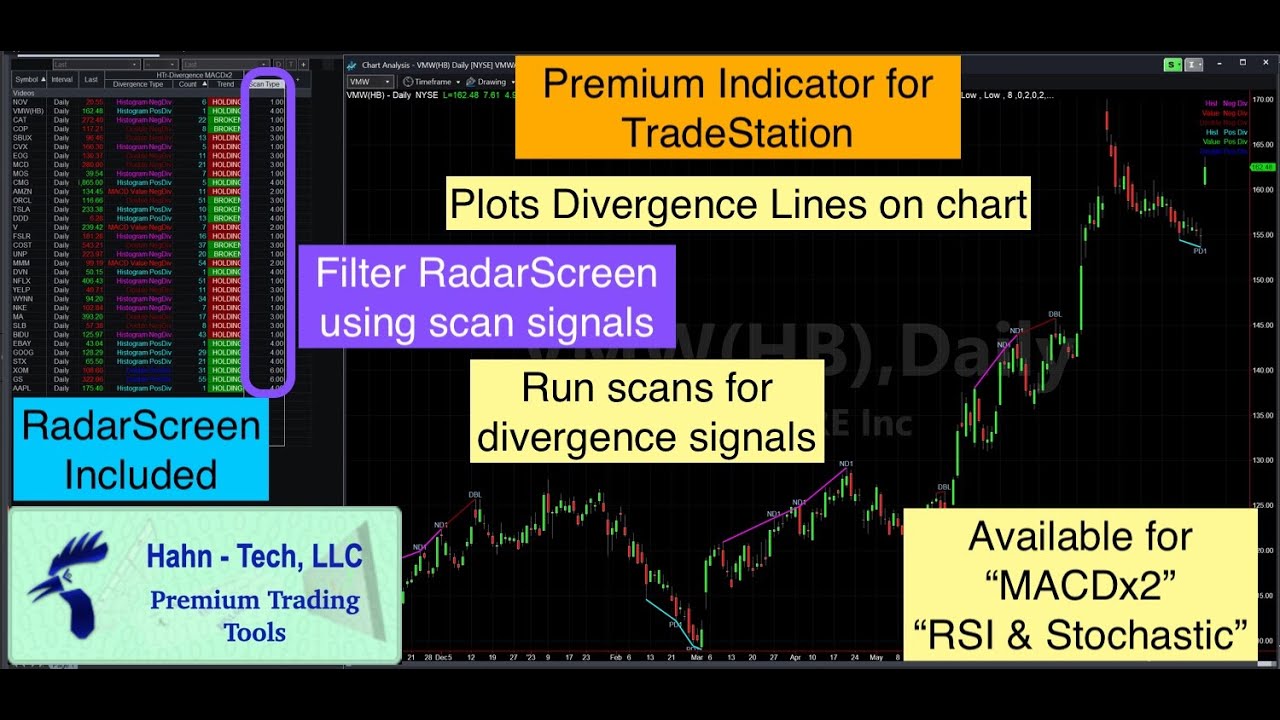
Dynamically plots trendlines and labels on the chart showing places where positive and negative divergence are present. A custom scan and chart based alerts are included. Able to plot swing high and lows. Also includes a color legend to easily identify one type of divergence from another. Along with the new indicator we have published a video titled “TradeStation Divergence Lines Indicator”. In this video we show how to adjust the settings and run the scan. Included in the video is a live chart demo showing how the chart based alerts function in real time. At the request of viewers, we have also added a companion study, available separately. The companion study measures hidden divergence.
Additional data and platform subscription rates may apply.
TradeStation Version Support: Developed and Tested on Version 9.5 (Update 17)
Previous versions may be supported but have not been tested.
Index of topics:
05:05 Installation
06:23 Reading MACDx2 Divergence Signals
09:29 Adjust Inputs
23:54 Reading Hidden Divergence Signals
28:28 RadarScreen: Standard Divergence
33:23 RadarScreen Hidden Divergence
34:37 RadarScreen: Alerts
36:35 Reading RSI & Stoch Divergence Signals
41:13 Scans
47:53 Live Chart Demo
53:51 How To Order
DISCLAIMER: I AM NOT A CERTIFIED FINANCIAL ADVISOR AND NOTHING IN THIS VIDEO OR TEXT IS AN ADVERTISEMENT OR RECOMMENDATION TO BUY OR SELL ANY FINANCIAL INSTRUMENT. NOR IS THIS VIDEO OR TEXT INTENDED TO INSTRUCT YOU ON HOW TO MAKE BUY OR SELL DECISIONS USING ANY OF THESE INDICATORS.
TradeStation is a chart analysis and trading platform offered by TradeStation Group Inc. http://www.tradestation.com/
| この動画について | |
|---|---|
| URL | https://www.youtube.com/watch?v=tPdCviD12gQ |
| 動画ID | tPdCviD12gQ |
| 投稿者 | Hahn-Tech, LLC |
| 再生時間 | 59:35 |
コメント