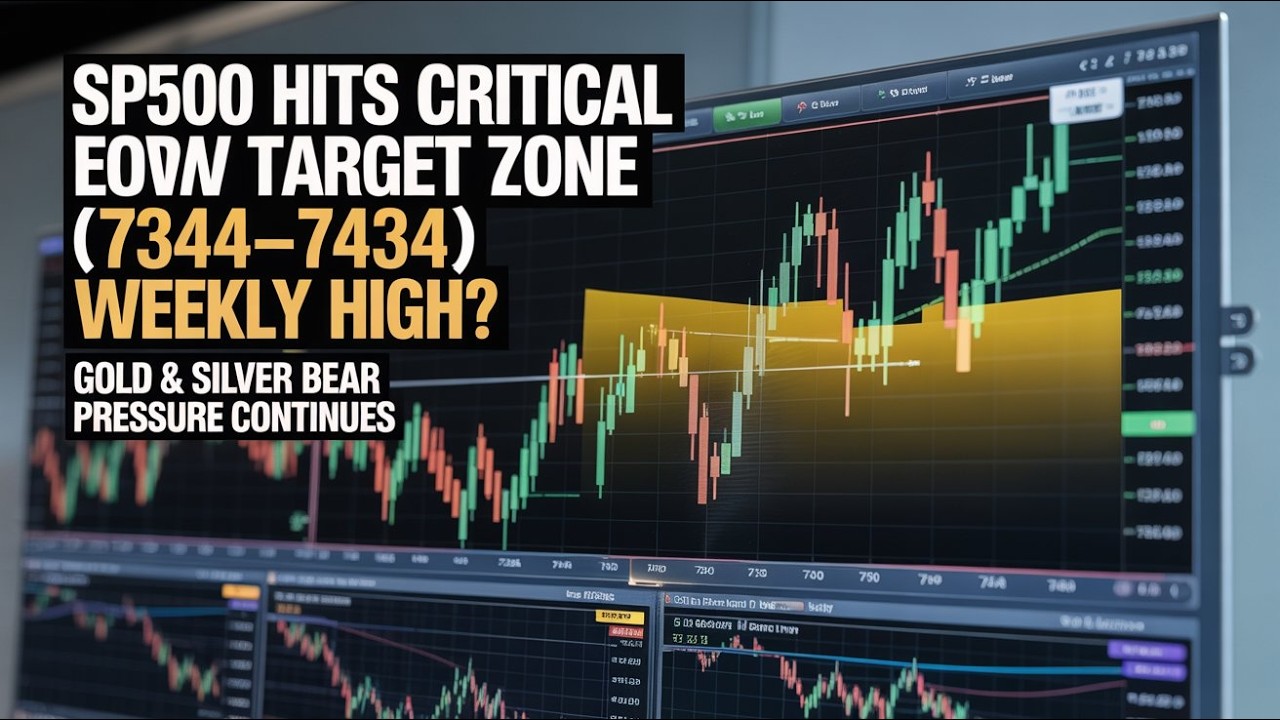
The S&P 500 appears to have formed a potential weekly top last week.
Key level:
👉 A daily close below 7,300 would confirm the bearish scenario and signal that a deeper correction may be underway.
The Nasdaq Composite is showing a similar structure, while the Dow Jones Industrial Average continues to hold up better relative to tech-heavy indexes.
📈 Stock Market Outlook
• SPX testing key support near 7,300
• Nasdaq showing weaker momentum
• Dow remains relatively stronger
• Waiting for confirmation of the weekly top
The next few sessions could become very important for the overall market direction.
🥇 Gold & Silver
The strength in Gold and Silver has been stronger than expected.
Because of that:
• The bearish $4,000 gold scenario may no longer be valid
• A weekly low could be completed by early June
• A major buying opportunity may be approaching soon
Precious metals are showing an improving technical structure compared to previous weeks.
🛢 Crude Oil Outlook
West Texas Intermediate appears to be forming an intermediate top.
Outlook:
• Potential weekly low → mid-June
• After the correction, a powerful rally could begin
• Long-term upside target remains near $140
The setup suggests crude may still be in a larger bullish cycle despite near-term volatility.
🔎 Big Picture
• Stock indexes may have completed a weekly top
• SPX below 7,300 would confirm weakness
• Gold & silver improving technically
• Precious metals could offer a major buying opportunity soon
• WTI correction may lead to a parabolic rally later this year
Contents in this video:
…………………………………………………………………………….
00:00 – Introduction
00:10 – S&P 500 #spx price action analysis
01:38 – Nasdaq #ndx price action analysis
02:05 – Dow Jones Industrial Average #us30 price action analysis
03:48 – Gold #gold analysis
05:38 – Silver #silver analysis
07:15 – Crude #wti analysis
09:05 – #bitcoin analysis
…………………………………………………………………………….
I highly recommend watching the two videos below:
1) My Stock Market Forecast for 2025
2) Hidden Signal | QM Patten | Supply and Demand Lesson
3) QM Pattern within the supply and demand area
Please subscribe to us:

Reach me at: https://t.me/SafiFinancialNetwork
Lots of good materials have been covered
#TechnicalAnalysisWithAliii
#Technical_Analysis_With_Aliii #AliiSafi #AliSafi #Stcoks #StcokMarket #Trump #DonaldTrump #technical_analysis #SP500 #Nasdaq #DowJones #Gold #Silver #CrudeOil #MiddleEastWar #Trump #StockMarketCorrection #AliSafi #OilPrice #GoldForecast #TechnicalAnalysis #MarketUpdate #InvestingNews #MacroView #VolatilityAhead
Telegram: @SafiFinancialNetwork
Instagram: @aliiiiiSafi
| この動画について | |
|---|---|
| URL | https://www.youtube.com/watch?v=spLIJTF8WyI |
| 動画ID | spLIJTF8WyI |
| 投稿者 | Technical Analysis with Aliii |
| 再生時間 | 11:31 |

コメント